What are HR metrics and why are they important?
HR metrics are measurements or formulas used to track and evaluate workforce performance. They can uncover valuable insights about your organisation, such as how engaged your employees are, how frequently people are leaving or joining, how many absences are taken and the associated costs.

As HR teams play a more strategic role in business operations, they need reliable data from across the organisation to identify trends, measure performance and demonstrate the impact of HR initiatives.
These insights enable HR leaders to develop strategies that support business objectives, improve employee outcomes and make more informed decisions.
HR software makes it easier to collect and analyse the data behind these metrics, particularly when integrated with other people management systems, such as payroll and workforce management.
What types of HR metrics should you be measuring?
There are lots of HR metrics you can use to measure and evaluate processes across your organisation. Grouping these into categories can help you understand which metrics impact different areas.
Recruitment
Recruitment metrics measures the effectiveness of the hiring process. They help HR teams attract the best talent and improve the candidate experience while optimising expenses. They can also help reduce costs while increasing quality and speed.
Retention
Retention metrics aim to understand how often people are leaving your organisation and why. Organisations could use this information to implement initiatives that encourage more employees to stay, or plan for future skill gaps.
Employee engagement
Employee engagement metrics measure how satisfied and motivated your employees are working at your organisation. Survey results can provide feedback on current employee morale and organisation culture.
These metrics can show you when engagement starts to drop, so you have time to improve engagement before it becomes a retention issue.
Performance
Performance metrics measure employee contribution and whether they are meeting your organisation’s goals. This helps understand workforce effectiveness and how you can support employees if performance drops.
Workforce management
Workforce management metrics relate to tracking whether you have the right employees in the right place at the right time. Having this data can help to improve workforce productivity. For example, understanding absence rates, overtime rates and output per hours worked.
Formulas for common HR metrics
Depending on what you want to measure, there are lots of different formulas that can be utilised as HR metrics. Below we cover 10 common formulas used by HR teams to monitor workforce and organisational performance.
Employee turnover rate
Employee turnover rate measures the percentage of employees who leave your organisation over a specific period. Tracking turnover identifies potential retention challenges and workforce stability.
Turnover is expected; however, consistently high turnover can indicate underlying issues within your organisation. Turnover averages also differ depending on the industry. CIPD data shows that rates vary from 25% in public administration to over 50% in hospitality.
Formula:

Higher than average turnover could be due to several reasons:
- Uncompetitive salaries
- Toxic work culture
- Poor management processes
- Lack of career development
- Poor work environment
- Burnout
- Poor work-life balance
Understanding employee turnover enables you to spot trends in employees' leaving and explore the reasons why. It’s especially important to monitor in the early stages, as issues can become larger and more impactful challenges in the future.
High turnover rates may lead to increased recruitment costs and decreasing productivity and morale within teams. Beyond this it can leave department gaps too, as roles become vacant and knowledge leaves your workforce.
To help decrease turnover rate, strategies and incentives can be implemented to help stabilise the workforce. These could include competitive salaries, development opportunity plans, or flexible work arrangements.
Employee retention rate
Employee retention rate is the percentage of employees who stay at your organisation over a specific period.
Formula:

This calculation should exclude new hires during that time period.
A declining retention rate could indicate issues such as limited career development, ineffective management, a toxic workplace culture or poor employee experience.
Decreasing retention rates can also lead to higher expenses. Hiring, training, and onboarding can add up. A constant cycle of new recruits doesn’t allow valuable skills and organisational knowledge to stay long-term.
There are many strategies or incentives that increase retention. Some of these include:
- Competitive salaries
- Employee benefits
- Flexible work options
- Career development plans
- Employee recognition
- Wellbeing initiatives
Cost per hire
Cost per hire is the average amount it costs to hire a new employee. This is associated with the cost of filling a vacant role.
Formula:
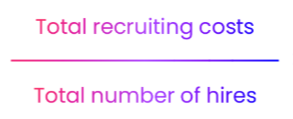
Recruitment costs cover everything from advertising the position, to training and onboarding expenses. This data allows you to understand the breakdown of cost and budget alignment.
A high cost per hire isn’t always a concern. For example, a vacant senior position will usually require a higher cost per hire to attract and retain the right talent. But constant rising costs could point to inefficiencies within the recruitment process.
Factors which can increase the cost per hire include:
- Long recruitment processes
- Advertising costs
- High employee turnover
- Long onboarding or training requirements
Monitoring this metric over time can help you manage recruitment budgets and identify opportunities to streamline costs. This is particularly important in periods when budgets are tight, during rapid growth, or restructures.
Time to hire and time to fill
Both time to hire and time to fill measure how efficient your recruitment process is, but with a slight difference:
- Time to hire measures the number of days from when a candidate applies for a role to when they accept the job offer.
- Time to fill is the amount of time from when your organisation posts the job vacancy to when the offer is accepted by a candidate.
These each demonstrate how efficient the recruitment process is, and if roles are filled within the right timeframe.
Each metric can be split apart and analysed at each stage of the process:
- Screening
- Interviews
- Approvals
- Communication channels
The results provide greater visibility over any bottlenecks in the process, which can be adjusted or removed to minimise delays.
Extended time periods within recruitment for both metrics could lead to:
- Losing top talent to competitors
- Increased internal pressure and burnout
- Internal project delays
- Higher recruitment cost
- Internal skills shortage
In the UK, the average time to hire is 4.9 weeks, with 62% of candidates losing interest when recruitment processes take too long. When viewed alongside cost per hire and the quality of new hires, this helps you understand whether you're recruiting both efficiently and effectively.
Absenteeism rate
Absenteeism rate measures the proportion of working time lost to employee absence over a specific period.
Formula:

Factors for high absenteeism can include:
- Toxic culture
- Excessive workload
- Low morale and engagement
- Poor employee support
- Burnout
High absence can offload workload onto present employees, creating a knock-on effect. Present employees face higher pressure and demand at work, risking further increases in absenteeism.
This can then lead to decreased productivity, difficulty in workforce planning, and delays or disruptions to operations.
HR software, like People First, helps you to monitor absences at scale. If a particular employee is frequently absent, you can gather evidence through the absence history, then address it and provide support.
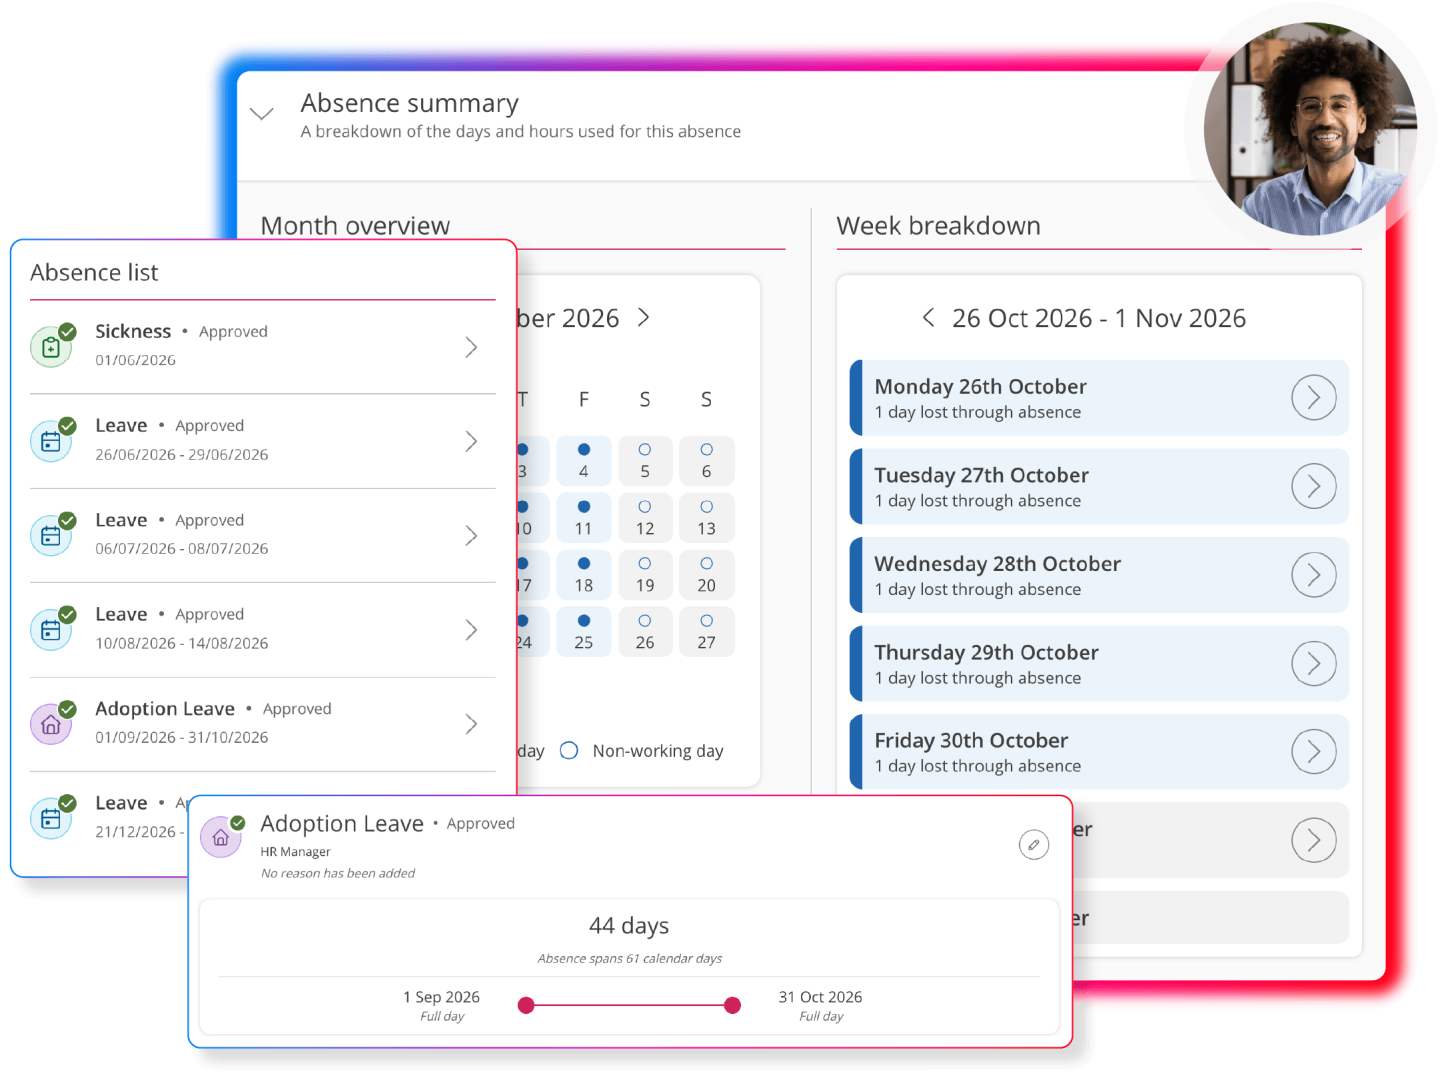
Improving absenteeism rates could be achieved by providing support for employees including:
- Improving workplace culture
- Wellbeing support
- Flexible options for remote working
- Supporting a better work-life balance
- Reviewing workload and staff distribution
Monitoring this alongside other metrics, such as employee engagement, can provide a clearer picture of workforce health and allows you to support your employees.
Overtime rate
Overtime rate is the extra time employees work outside their contracted hours. Overtime occurs when there is an increased demand on workload with closing deadlines.
Occasional overtime in normal in certain industries, especially during busy periods. However, continuously high rates of overtime can link to poor resource allocation, staff shortages or ineffective workforce planning and management.
Formula:
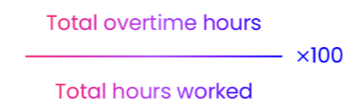
Overtime may impact:
- Costs, due to the premium hourly rate
- Increased absenteeism
- Increased risk of employee burnout and stress
- Knock-on effects to higher turnover
- Decreased work-life balance
- Possible decrease in productivity, engagement and performance
Tracking overtime allows you to understand which teams need additional support or increased allocation of resources. Implementing open communication channels and support will help minimise the risk of high pressure and demand.
Another way to help your teams is by setting realistic deadlines with the current staff available, and supporting employees to have a sustainable work-life balance.
Learning participation rate
Learning participation rate measures the number of employees at your organisation who take part in a course, training, or programs.
Formula:

Learning and training courses can be implemented via a learning platform to strengthen workforce knowledge and skills. Content can be tailored for individual development or assigned for compliance and regulatory needs.
Participation rate can be increased by:
- Offering rewards
- Creating collaborative content
- Dedicated training time
- Value added to development
- Active, engaging, and relevant content
- Reducing user barriers by increasing flexibility
Learning experience platforms, like People First, provide a way for organisations to offer personalised learning and user generated content in an intuitive system. This supports participation and engagement.
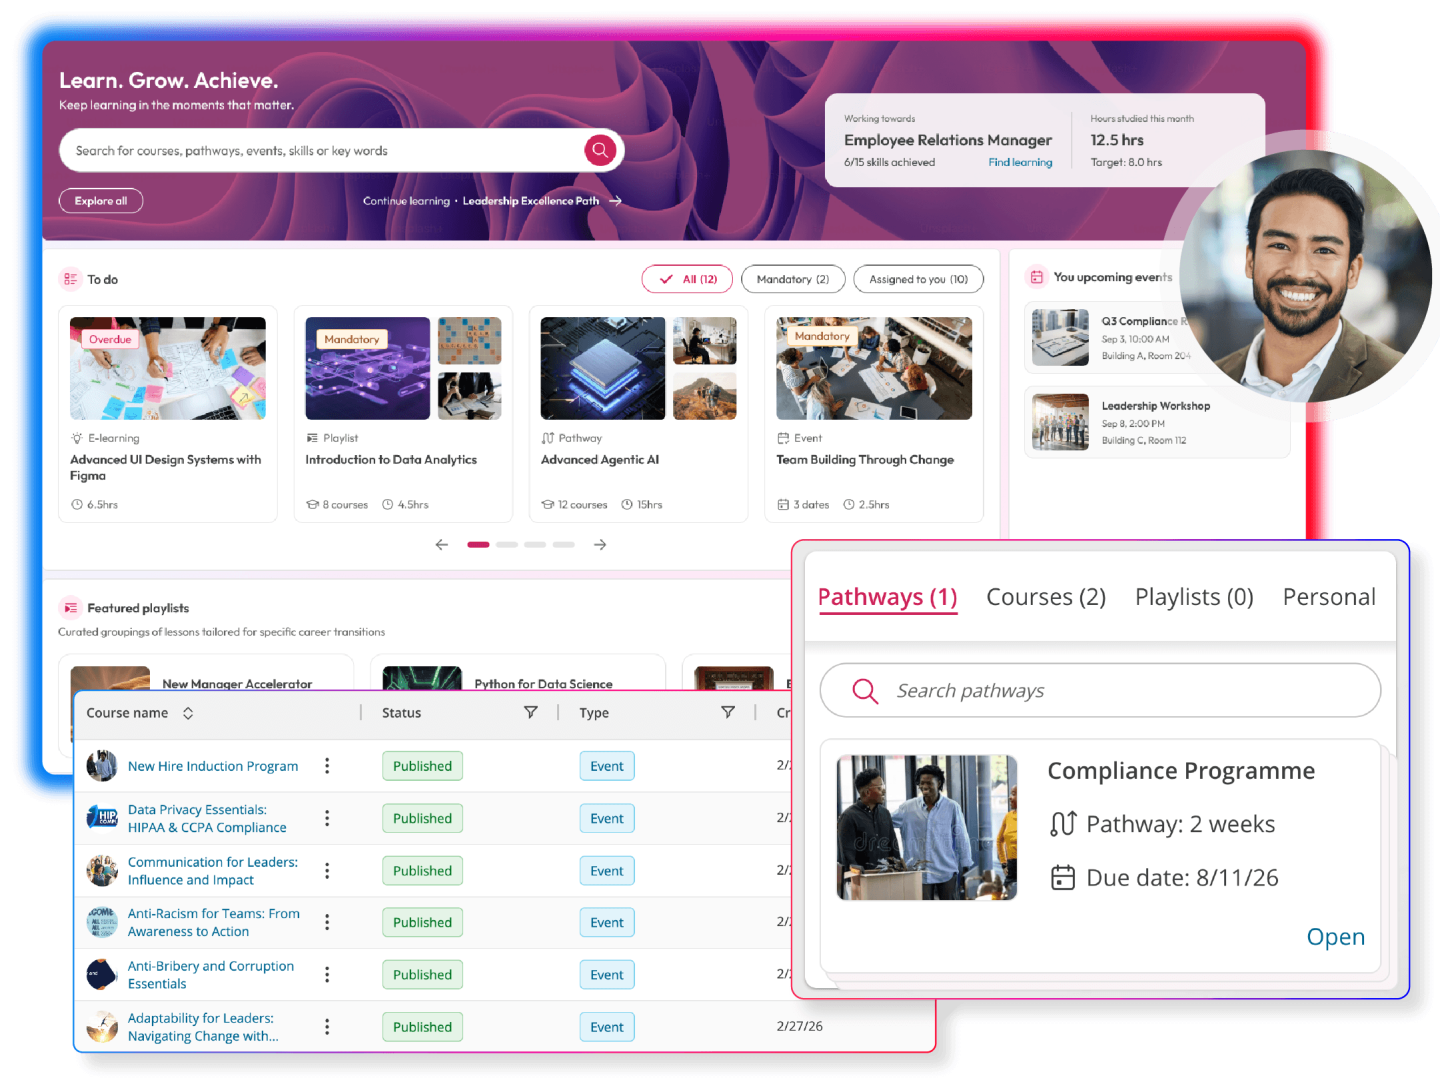
Custom learning pathways balance mandatory courses for compliance and business requirements with optional additional learning, for employees who want to develop their skills further in a certain field.
Self-service features also enable employees to learn at a cadence that suits them.
Employee engagement
Employee engagement reflects how employees feel about their work, workplace and organisation. It’s typically measured through surveys covering areas such as leadership, career development, recognition and work-life balance.
A common metric for measuring employee engagement is employee Net Promoter Score (eNPS).
Employee Net Promoter Score (eNPS) measures how likely employees are to recommend your organisation as a place to work. Employees are typically asked to answer a survey question using a scale from 0 to 10.
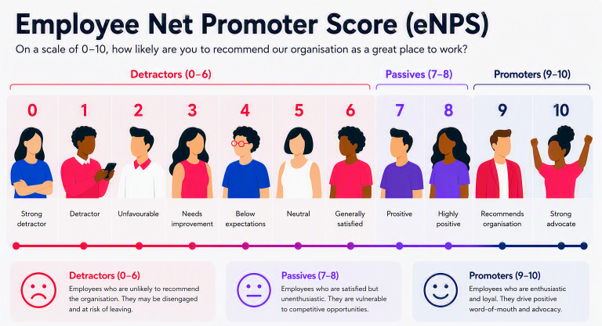
Scores 9-10 (Promoters):
- The loyal employees satisfied at work and who are very likely to recommend your organisation to others
Scores 7-8 (Passives):
- The neutral employees in the organisation
Scores 0-6 (Detractors):
- The unhappy and unsatisfied employees who don’t recommend or speak positively about your organisation
Use your promoters’ and detractors’ percentage to see your eNPS score. Your final score will fall from -100 to 100.
eNPS score formula:

eNPS helps management gain insight into workforce satisfaction, so your organisation isn't blindsided by high staff turnover. It can also be an indicator of how productive and motivated your employees are.
Even if engagement is currently high, it’s beneficial to regularly monitor, to ensure your workforce remains motivated and engaged.
Equality, diversity, inclusion, and belonging (EDI&B)
Equality, diversity, inclusion and belonging (EDI&B) is a framework for creating a fair, respectful and supportive workplace where employees can access opportunities, feel valued and contribute fully.
Equality means ensuring employees have fair access to opportunities and are not prevented from succeeding by unnecessary barriers.
Diversity refers to the range of backgrounds, experiences and identities represented across your workforce. This may include differences in:
- Age
- Gender
- Race and ethnicity
- Disability
- Religion or belief
One formula you can use to measure workforce diversity is:

Inclusion means actively ensuring that employees’ voices are heard, respected and considered, and that everyone has a fair opportunity to participate and progress.
Belonging focuses on how employees feel at work. It reflects whether they feel accepted, valued and able to be themselves in a safe and supportive environment.
Without effective EDI&B practices, organisations may be more vulnerable to bias, stereotyping, unfair judgement and misrepresentation.
Building a diverse workforce can bring new ideas, experiences and perspectives to your organisation. It can also strengthen your understanding of a wider customer base and help you build stronger connections with the communities you serve.
Internal mobility rate
Internal mobility rate measures the percentage of employees who move roles within your organisation during a specific period. This can include promotions or transferring departments, teams or location.
Formula:

Internal hires often take less time and cost less to process than external recruitment. A strong internal mobility rate can therefore help reduce recruitment costs, support employee development and improve retention.
Organisations can encourage internal mobility by prioritising internal candidates, offering career development opportunities and providing clear progression pathways. Tracking this metric helps you assess whether these initiatives are supporting employee growth and retention.
How our HR software can help
The HR metrics covered in this guide are just a starting point. Depending on your organisation’s priorities, other measures may provide valuable insight, such as:
- Training costs per employee
- Revenue per employee
- Time to productivity
- Quality of hire
Once you’ve identified the metrics that matter most to your organisation, you can establish benchmarks and use them to:
- Compare performance with previous periods
- Track trends over time
- Set measurable targets
Reliable HR data helps you make evidence-based decisions rather than relying on assumptions. However, collecting, analysing and interpreting this data manually can be very challenging and time-consuming.
People First brings HR, payroll, workforce management, learning and finance data together in one connected platform, helping you access the insights needed to make more informed decisions.
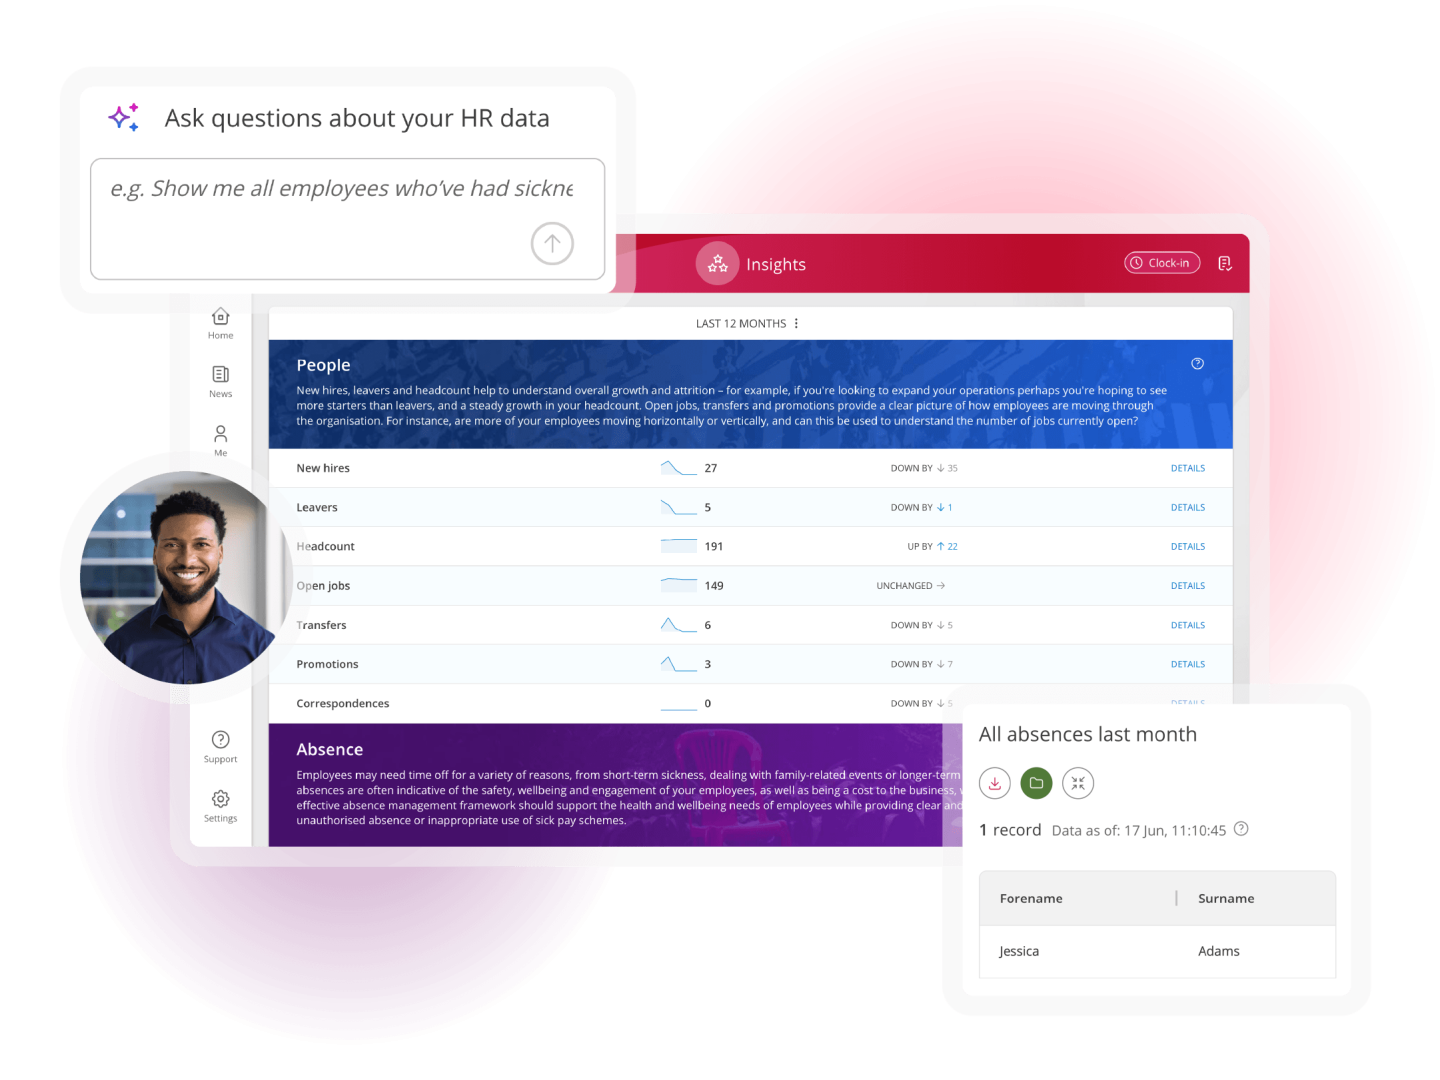
With accessible dashboards, connected workforce data and AI assistance built in, People First helps you identify trends, monitor key metrics and reduce the administrative work involved in reporting. This gives your HR team more time to act on insights and support wider business goals.
As Connor Clement, Senior HR Manager at Picture Production Company, explains:
“We are now able to use data from People First to develop our HR strategy for the coming year. Having access to all that data in a centralised space is hugely valuable.”
Book a People First demo to learn more: