Your workplace needs more WOW. Get ready for MHR's World of Work 2026
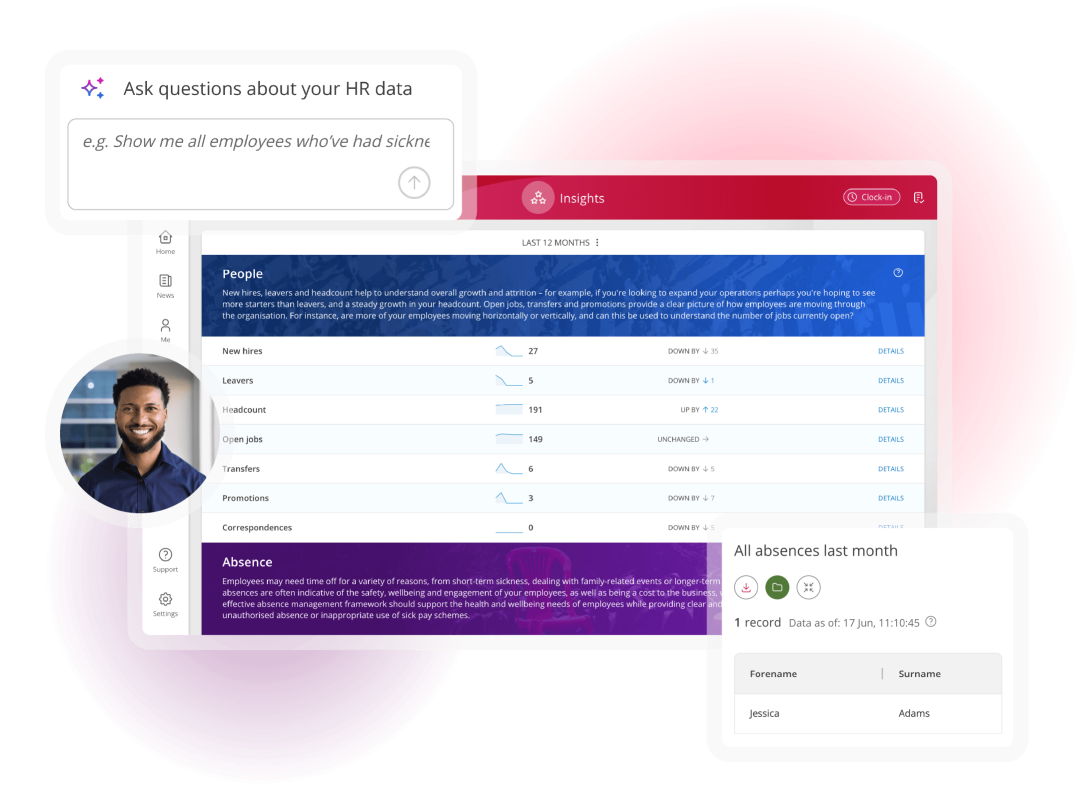
HR reporting & analytics software
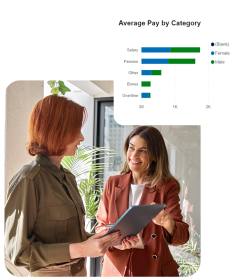
Our people analytics and BI reporting tools give leaders real-time visibility into workforce trends, labour costs, retention, and performance. You'll plan more effectively and respond faster to change. Go beyond gut feeling and back your actions up with real data.
Image
Image
Image
Image
Image
Image
Image
Image
Image
Image
Image
Image
Image
Image
Image
Image
Image
Image
Image
Image
Image
Image
Image
Image
Image
Image
Image
Image
Image
Image
Image
Image
Image
Image
Image
Image
Image
Image
Image
Image
Image
Image
Image
Image
Image
Image
Image
Image
Image
Image
Image
Image
Image
Image
Image
Image
Image
Image
Image
Image
Image
Image
Image
Image
Image
Image
Image
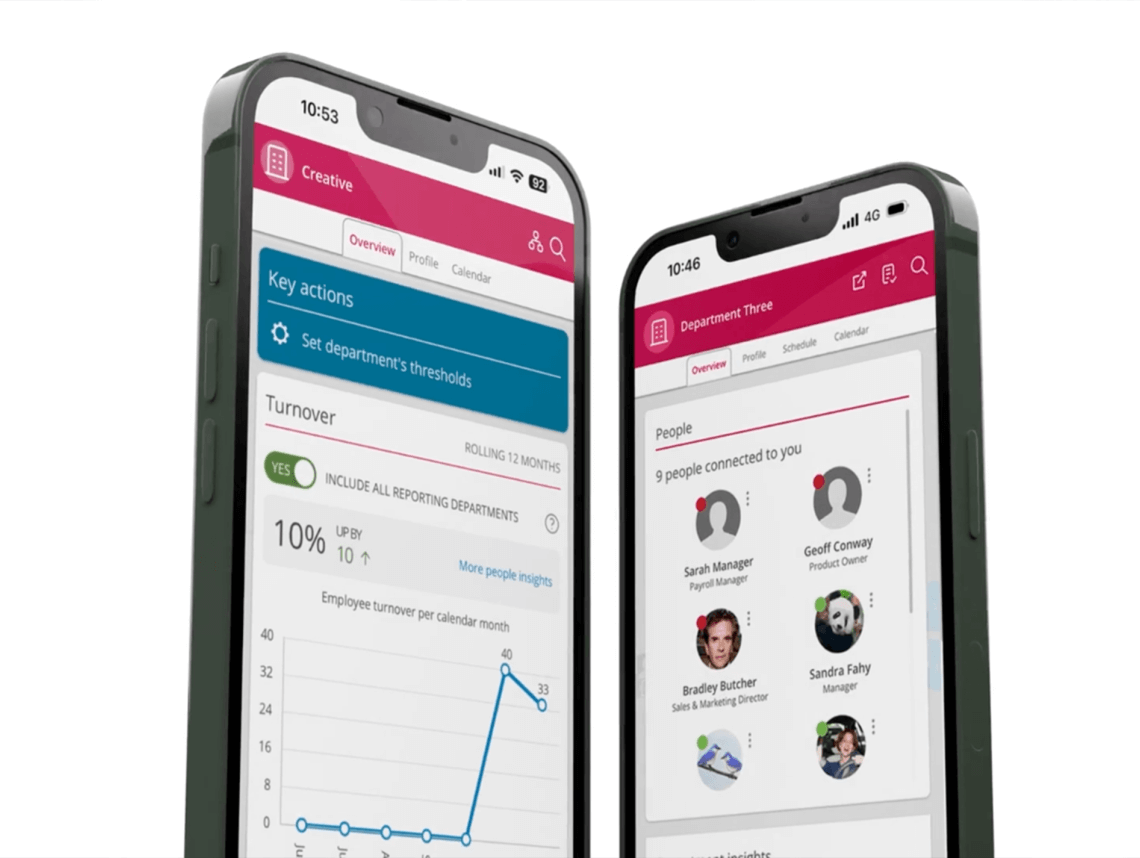
Data-driven insights are a lot easier when you have all the data
Image
Image
Image

Image
Get started on your data transformation journey
Make your data work harder
Microsoft Power BI
Are you tapping into the full potential Microsoft Power BI can offer? Our data consultants can help you make more of your Microsoft Power BI licence and harness your people and payroll data to give you the competitive edge.

Made to measure
Whether you need detailed compliance reports or dynamic performance dashboards, our bespoke data reporting services will meet your specific requirements. Strategic reporting using predictions and forecasts = driving your organisation forward by setting long-term business targets.

Data consultancy
The sheer volume of data can be overwhelming. Our data consultancy services can ease the pressure and help you navigate the data jungle using a more structured and tailored approach. Our specialists speak fluent data and can provide advice and innovative solutions to leverage your data to its fullest potential.
Harness the full power of Microsoft Power BI and deliver measurable results

“Now we’ve devolved the data mart to our leaders, they can see real-time information, which means they can work with our people business partners and track what is going on in real-time in their service areas and be more proactive in how they respond to people issues.”

“We are now able to use data from People First to develop our HR strategy for the coming year. Having access to all that data in a centralised space is hugely valuable.”


Think you're ready for AI? Our latest white paper explains why you aren't.


Data analytics tools FAQs
-
It's the science of turning raw data into actionable insights. With data analytics, you're not just guessing. You're making decisions backed by solid evidence. Understand and influence positive decision-making in the following areas:
- Financial performance
- Salaries
- Payroll
- People
- Health and Safety
- Recruitment
-
While data analytics encompasses the broad practice of analysing data sets to extract insights, business analytics zeroes in on using them to solve specific problems and make strategic decisions. Data analytics is the toolkit. Business analytics is the application of those tools to achieve your goals.
-
It's a cloud-based reporting tool that facilitates the visualisation and analysis of data with lightning-fast speed and ease of use. It's a market leader among the BI tools available.
This big data analytics tool connects multiple cloud and premises-based data sources. The result? Detailed reporting, a comprehensive suite of dashboards and the ability to share information across your organisation in real-time.
-
Making decisions without them is like flying blind. These tools break down mountains of raw data so you can understand trends, predict outcomes and make smarter decisions.
They automate complex processes, save time and uncover hidden opportunities that manual analysis might miss. Stay ahead of the competition. Proceed with confidence and precision.
-
It can be as quick as a few weeks to a couple of months, depending on what sort of data it is, what you want to do with it and how it's stored. Think of it as setting up a high-tech kitchen. The basics can be ready in no time, but customising it for your needs might take a bit longer.
But with the right team and clear objectives, you'll be slicing and dicing data like a pro before you know it. The time invested upfront pays off with the learnings and efficiencies gained.
-
SAP Business Objects is a suite of reporting and analysis applications built around the core BO universe, enabling the combination of back and front-end data. End users can interact and build standard reports alongside powerful visualisations without worrying about where the data is being pulled from.
-
It's your very own smart, data-savvy assistant who organises your statistics into dashboards, charts and graphs. This makes it even easier to spot trends, track performance and make informed decisions. BI reporting goes one step further though, allowing you to interact with the data, turning complex sets into clear, actionable information.
-
The cost of our data analytics platform varies depending on business size, the type of software and the level of support required. We offer everything, from out-of-the-box business intelligence reporting to bespoke packages.
To see where our solutions could take you, get in touch for a no-obligation quote.
-
The dynamic duo for future-proofing your business. Predictive analytics uses historical data to forecast future trends and outcomes with minimal manual intervention. Prescriptive analytics uses learnings to make decisions without any manual intervention. Together, they help you anticipate changes and act proactively. Stay one step ahead.
-
Turn data fog into crystal-clear clarity. Decision-making streamlined. Efficiency boosted. Overlooked opportunities become key business drivers. These tools eliminate guesswork, empowering your team to make smarter decisions. In short, they transform your workplace into an insight-driven machine that's ahead of the curve.
For more information on the application of analytics and how BI reporting tools can benefit your organisation, read our handy guide.
-
Gain a comprehensive, high-level overview of your entire organisation's performance, all in one place. Enterprise reporting creates detailed, standardised reports that aggregate data from various departments and systems, providing a 360-degree view of your business.
Monitor key performance indicators, track progress towards goals and ensure alignment across your organisation.
-
This vast digital reservoir is where all your data flows in. Unfiltered and unprocessed. Ready for exploration. It stores everything – structured and unstructured data. It's your go-to resource for diving deep into data analytics, allowing you to syphon valuable insights when needed.


