Data Visualisation Consultancy
Every organisation has a story. Data visualisation gives you the tools to make yours shine. business. With quick and easy access to insights through visual dashboards and reports, you’ll be able to craft your data storytelling to make quicker and more informed decisions.
We can help you:
- Understand what’s really going on in your business and report on it to all stakeholders
- Collate and interpret data more efficiently with no more manual processes
- Get the right analytics in place, letting you focus on really digging into insights

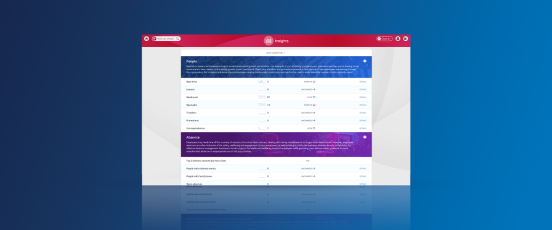
Bespoke dashboards

Access to exec level reporting

Collaboration

A single source of truth

Drive engagement
Microsoft Power BI
Nearly 62% of organisations are not using their Power BI license to its full potential. As a Microsoft Partner we’re always up to date with the latest developments in technology and have the knowledge and expertise you need to get the most out of your license.

Effective data storytelling
Our expert team will bring greater depth of understanding by expanding your data sets with narrative techniques to help drive more self-service analysis and help to distribute the use of data across your organisation’s workforce.

Data quality and delivery
It’s widely accepted that the key to the most effective insights is ensuring that quality data is at the core.
Our team of experts can guide you in establishing a clear data strategy that supports your business and ensures that strategic decision making is always based on quality insights.

Maximise your ROI
While a large proportion of organisations have some sort of reporting tools in place, they’re often going under-utilised.
Don’t settle for the basics, make sure you’re getting the results you need. We have a range of training and support solutions that will ensure you get the most out of your data.

Get in touch to book your free data discovery session
Accessing insights
Getting meaningful insights doesn’t have to be a challenge. Our team of data analytics and visualisation experts have the skills and experience to make the complex simple.
Single source of truth
We can combine data sets from across your organisation or third parties into a single interface, avoiding siloed analytics and ensuring everyone has visibility of the most up to date data for accurate reporting.
Real-time data
With modern processing tools your data will be readily available, giving you answers on demand at the click of a button – ensuring you’re always ahead of the curve.
Identify trends
Easily analyse and view large volumes of data, highlight trends and make more informed forecasts that can drive your organisation forward.
Analyse large data sets
Condense and structure large and complex data sets into consumable insights with simple to use controls for easy comparisons and output tailored to individual users.
Collaboration
Easily tell your organisation’s story with visualisations that can be shared at the touch of a button for collaborative decision making.
Drive engagement
Build a data driven culture across your organisation with self-service analytics using intuitive dashboards that are easy for end users to adopt, use, interpret and understand.